Engagement rate calculator
This free engagement rate calculator works out your rate on Instagram, TikTok or Facebook from your likes, comments, shares and saves. Divide by followers, reach, impressions or views, whichever your platform or report uses.
Your engagement rate
How to calculate engagement rate
Engagement rate is the number of interactions divided by your chosen audience total, multiplied by 100. One person can contribute several interactions.
engagement rate = (likes + comments + shares + saves) ÷ audience × 100
For more than one post, the calculator divides the total by the number of posts first. With followers as the audience, that is the average post's rate. With reach, impressions or views, it is total engagements divided by total reach, impressions or views (you enter the average per post), which weights busier posts more than a plain average of each post's rate. The example button uses a made-up Instagram account:
- Engagements: 900 likes + 80 comments + 30 shares + 90 saves = 1,100 across 5 posts.
- Per post: 1,100 ÷ 5 = 220 engagements.
- Rate: 220 ÷ 10,000 followers × 100 = 2.20%.
The only thing that changes between the formulas people quote is the audience you divide by. The calculator lets you pick one:
| Divide by | Also called | Use it when | Who can see it |
|---|---|---|---|
| Followers | Engagement rate by followers (ER) | Comparing accounts, or checking a public account you don't run. | Anyone |
| Reach | Engagement rate by reach (ERR) | You want the rate among people who saw the post at least once. | The account owner, in the platform's insights |
| Impressions | Engagement rate by impressions | Your report counts every time the post was shown, repeats included. | The account owner |
| Views | Engagement rate by views (ERV) | The post is a video and views are the number the platform gives you. | Public on many video posts, fuller detail to the owner |
Names vary between tools and platforms change what they show. Check the definition in whatever report you take your numbers from.
A rate by followers will usually differ from a rate by reach or views for the same post, because a post can be shown to people who don't follow you, or to only some of the people who do. That is why two calculators can give two answers for the same account. Other calculators may divide by a different audience number, so check that before you compare.
Engagement rate on Instagram, TikTok and Facebook
The arithmetic is the same on every platform. What differs is which interactions the platform shows you and which audience number is easiest to find.
| Platform | Interactions to add up | Audience number to use | Worth knowing |
|---|---|---|---|
| Likes, comments, shares, saves | Followers for a quick rate, reach for a fairer one | Saves and shares are in your post insights, not on the public post. | |
| TikTok | Likes, comments, shares, saves (favourites) | Views | Videos are shown to people who don't follow you, so views usually describe the audience better than followers do. |
| Reactions, comments, shares | Reach, or page followers | Reactions go in the likes box. Leave saves empty. |
Check the names in your own analytics; platforms rename and move these numbers.
Link clicks aren't counted here. They are a different action, closer to a click-through rate, and you can work that out with the CTR calculator.
What is a good engagement rate?
There isn't one number to aim for. The rate depends on the platform, on what you divide by, on how big the account is and on what the tool counts as an engagement. A benchmark someone else measured with a different recipe says little about your account, so this page doesn't print one.
Useful comparisons are your own:
- Keep the recipe fixed. Pick one audience number and one set of interactions, and use them every time.
- Compare like with like. Reels against reels, this month's posts against last month's, one format against another.
- Use enough posts. One post can spike for reasons that have nothing to do with you. An average over five or ten posts says more.
- Look past the rate. A high rate on a small audience can bring fewer people to your site than a lower rate on a large one. The next step is what those people do.
From engagement to visits and sales
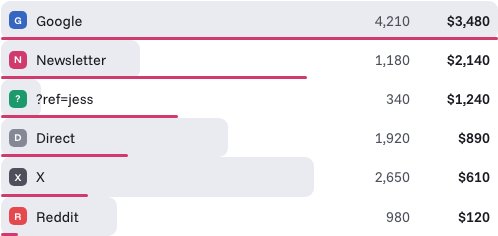
Engagement tells you people liked a post. It doesn't tell you whether anyone came to your website, or bought. Stickybeak picks up where the platform's numbers stop: it is live analytics for every site you own, and it shows which visits came from each channel (X, Reddit, a newsletter, a ?ref= code) and the revenue they led to.
Tag the links you post with UTM parameters and you can set a post's engagement beside the visits it actually sent. The referral traffic guide covers how social visits show up, and the conversion rate calculator turns those visits into a rate. The platform counts engagement and Stickybeak counts visits that loaded your page, so the two will not match exactly. Stickybeak is in early access.
Questions
How do you calculate engagement rate?
Add up the interactions (likes, comments, shares and saves), divide by the audience number you are measuring against, then multiply by 100. With 1,100 engagements across 5 posts and 10,000 followers, the average post got 220 engagements, so the rate is 220 ÷ 10,000 × 100 = 2.20%.
How do you calculate engagement rate on Instagram?
Add the likes, comments, shares and saves on a post (or the average across several posts), divide by your follower count, and multiply by 100. For a rate based on who actually saw the post, divide by its reach or impressions instead.
How do you calculate engagement rate on TikTok?
Add the likes, comments, shares and saves on a video, divide by the video's views (or by followers), and multiply by 100. Views is the base most often used on TikTok because the For You feed shows videos to people who don't follow you.
How do you calculate engagement rate on Facebook?
Add the reactions, comments and shares on a post, divide by the post's reach or by your page's followers, and multiply by 100. Use the same base every time so your numbers compare.
What is a good engagement rate?
There isn't one number. The rate changes with the platform, the base you divide by, the size of the account and what counts as an engagement, so a figure quoted for someone else's account says little about yours. Compare your own rate on the same base over time, or one type of post against another.
Should I use followers, reach, impressions or views?
Followers is the simplest and lets you check any public account. Reach, impressions or views measure engagement among the people who actually saw the post, which is fairer when a post travels beyond your followers. Reach and impressions are visible only to the account owner, in the platform's insights; view counts on many video posts are public. Pick one and keep it.
Do link clicks count as engagement?
Some tools count them and some don't. This calculator leaves them out so the number stays comparable between platforms. To follow what link clicks do after the click, look at the visits they bring to your site.
Does this calculator save what I enter?
No. Everything is calculated in your browser. Nothing you type is sent anywhere or stored.