ROAS calculator
This free ROAS calculator works out your return on ad spend from what you spent on ads and the revenue they brought in, and finds your break-even ROAS from your profit margin. Add a margin to see whether a campaign made or lost money after ad spend.
Your result
The ROAS formula
ROAS stands for return on ad spend: the revenue you get back for each unit of money you put into advertising. Divide the revenue from the ads by the ad spend:
ROAS = revenue from ads ÷ ad spend
It can be written three ways. A ROAS of 4 is also 4:1 (4 back for every 1 spent) and 400%. The example button uses an ad spend of 1,000, revenue of 4,000 and a 40% margin. Worked by hand:
- ROAS: 4,000 ÷ 1,000 = 4.00, which is 4:1 or 400%.
- Break-even ROAS at a 40% margin: 1 ÷ 0.40 = 2.50. This campaign is well above it.
- Gross profit on those sales: 4,000 × 0.40 = 1,600.
- Profit after ad spend: 1,600 − 1,000 = 600.
The calculator does the arithmetic and nothing else. It can't tell whether the revenue you entered was really caused by the ads, which is covered further down.
How to calculate break-even ROAS
Break-even ROAS is the ROAS at which a sale pays for its own advertising and leaves nothing over. Every sale keeps your profit margin as a share of its price, so break-even is the point where the revenue times the margin equals the ad spend:
break-even ROAS = 1 ÷ profit margin (margin as a fraction, so 25% is 0.25)
At a 25% margin that is 1 ÷ 0.25 = 4.00. Spend 1,000 on ads and you need 4,000 in revenue to break even, because 25% of 4,000 is the 1,000 you spent. Below that you lose money on the sale itself, and above it you make some. Choose Break-even ROAS above to try your own margin. The table shows how fast it climbs as margins get thinner:
| Profit margin | Break-even ROAS | Revenue needed per 1,000 of ad spend |
|---|---|---|
| 80% | 1.25 | 1,250 |
| 60% | 1.67 | 1,667 |
| 50% | 2.00 | 2,000 |
| 40% | 2.50 | 2,500 |
| 30% | 3.33 | 3,333 |
| 25% | 4.00 | 4,000 |
| 20% | 5.00 | 5,000 |
| 10% | 10.00 | 10,000 |
Each row is the formula applied to the margin shown. Revenue figures are rounded to the nearest whole number.
The margin to use is the one that is left after the costs that come with each sale (what the product costs you, shipping, payment fees, returns if you can count them) and before the ad spend. Leave a cost out and the margin looks fatter than it is, so break-even ROAS comes out too low. The result is only as honest as the margin you put in.
What is a good ROAS?
There isn't one number. A good ROAS depends on your margin, what else the sale has to pay for, and what you want from the campaign. This page doesn't list benchmark ratios, because someone else's average says little about your costs.
- Compare your ROAS with your break-even ROAS. Below your break-even ROAS, the sale itself loses money once the ad is paid for. Everything above it is profit on the sale, before overheads.
- A 50% margin breaks even at 2.00 and a 20% margin at 5.00, so the same 3.00 ROAS is comfortable for one business and a loss for the other.
- If customers buy again, a campaign running below break-even on the first order can still pay back later. That only holds if you have measured repeat purchases, not hoped for them. The customer lifetime value calculator works out the value of those repeat orders.
- Wait for enough orders before acting on a campaign's ROAS. A ROAS from a few days and a handful of orders can swing on one big order.
The useful comparisons are your own: this campaign against your break-even, and this month against last.
ROAS, ROI and profit: what each one tells you
ROAS looks at revenue only. It ignores what the product cost to make, so two campaigns with the same ROAS can have very different profit. ROI brings the margin in, and so does the profit-after-ads line in the calculator.
| Measure | Compares | Formula | Example |
|---|---|---|---|
| ROAS | Revenue with ad spend | revenue ÷ ad spend | 4,000 ÷ 1,000 = 4.00 |
| Profit after ads | Gross profit with ad spend | revenue × margin − ad spend | 4,000 × 0.40 − 1,000 = 600 |
| ROI on ad spend | Profit after ads with ad spend | ROAS × margin − 1 | 4 × 0.40 − 1 = 0.60, or 60% |
The examples are made-up numbers to show the arithmetic, not typical results.
ROAS also covers only the ad spend. Agency fees, creative, tools and staff time are not in it, so a campaign that clears break-even ROAS has not necessarily paid for everything around it. It sits alongside the earlier steps of the chain too: the CPM calculator prices the impressions, the CTR calculator measures the clicks and the conversion rate calculator measures the orders that follow.
Why the revenue in ROAS depends on attribution
Ad spend is a number on an invoice. Revenue is a judgement about which orders the ad caused. Ad platforms report a ROAS from the sales they credit to their own ads, using their own rules about which orders count. Your analytics may credit the same order to a different channel, or to direct. Neither figure is wrong, and they often won't match.
- Use one source of revenue for both sides. Spend and revenue should cover the same dates and the same campaigns.
- Calculate combined ROAS by dividing deduplicated revenue by total ad spend. Don't add platform ROAS ratios, and check whether multiple platforms claim the same orders.
- Tag your ad links. Without UTM tags, clicks from ads can land in referral or direct traffic, and the campaign gets no revenue. The UTM builder makes clean tagged links, and the UTM parameters guide explains the naming.
Where to see revenue by channel in Stickybeak
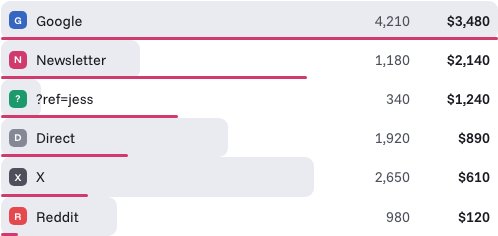
Stickybeak doesn't see ad spend. It shows the revenue half. Stickybeak is live analytics for every site you own: you can see revenue by channel, campaign and ?ref= code, and revenue per visitor. Each order keeps its trail: entry page, referrer, every UTM tag and the pages read before buying. Put the revenue a tagged campaign brought next to what you spent, and you have your own ROAS to compare with the platform's. Stickybeak is in early access and doesn't have a public price yet.
On a Shopify store the setup matters: the Shopify analytics guide explains that Stickybeak records storefront visits and, with a small theme edit, checkout starts, but it can't record completed orders or revenue there. For store revenue, use Shopify's own reports.
Questions
How do you calculate ROAS?
Divide the revenue from your ads by what you spent on them. If 1,000 of ad spend brought in 4,000 of revenue, ROAS is 4,000 ÷ 1,000 = 4.00, usually written 4:1 or 400%.
What does ROAS stand for?
Return on ad spend. It is the revenue you get back for each unit of money spent on advertising, before any other cost.
How do you calculate break-even ROAS?
Divide 1 by your profit margin as a fraction: break-even ROAS = 1 ÷ margin. At a 25% margin that is 1 ÷ 0.25 = 4.00. Below that ROAS each sale loses money once ad spend is counted; above it each sale makes money.
What is a good ROAS?
There is no single good ROAS. The floor is your break-even ROAS, which depends on your margin: a business with a 50% margin breaks even at 2.00, one with a 20% margin at 5.00. Anything above your break-even ROAS makes money on the sale itself, and how much more you want depends on your other costs and goals.
What is the difference between ROAS and ROI?
ROAS compares revenue with ad spend. ROI compares profit with cost, so it takes your margin into account. The two are linked: return on ad spend in profit terms = ROAS × margin − 1. At a ROAS of 4.00 and a 40% margin that is 4 × 0.4 − 1 = 0.6, or 60%.
Can ROAS be less than 1?
Yes. A ROAS of 0.50 means every 1 spent brought back 0.50 in revenue. It is below break-even for any margin, because even a 100% margin would need a ROAS of 1.00 to cover the ad spend.
Why does the ROAS in my ad platform differ from my own numbers?
The revenue half of ROAS depends on which orders get credited to the ad. Ad platforms count orders by their own rules and windows, and your own analytics may credit them to a different channel or to direct. The calculator works with whatever revenue figure you give it, so use the same source and the same dates for spend and revenue.
Does this calculator save what I enter?
No. Everything is calculated in your browser. Nothing you type is sent anywhere or stored.