Real-time website analytics: what live really means and when you need it
Real-time website analytics shows who is on your site right now and what they're doing, within seconds instead of in tomorrow's report. You need it when something is happening today (a launch, a send, a deploy, a sale). For everything else, daily totals tell you just as much.
TL;DR
- Real-time website analytics shows who is on your site right now, within seconds instead of in tomorrow's report.
- You need it when something is happening today: a launch, a send, a deploy or a sale.
- For everything else, daily totals tell you just as much.
Stickybeak puts every site you own on one live wall, with who is on now and a per-minute chart for each. It is in early access.
Get early accessThe short answer
What it is: a view that updates as visits arrive. The usual form is a count of people on the site now, the last half hour minute by minute, and where those people came from and which pages they're on.
When it helps: any moment you'd otherwise refresh and wonder. Launching a page, sending a newsletter, posting a link, shipping a change, watching for the first sale.
When it doesn't: deciding what to write, which channel to invest in or whether the month was good. Those need days or weeks of data, and a live view of a handful of visitors will only make you jumpy.
What "real time" means in analytics
Tools use the phrase for three different things, so check which one you're getting.
- A live view. A screen that moves while you watch: people online now, this minute's visits, new arrivals appearing. This is what most people picture.
- A short rolling window. Google Analytics 4's Realtime report, for example, shows activity from the last 30 minutes, with active users for the last 5 and 30 minutes per minute (Google's help page for the report, read 14 October 2026). It's fresh, but it only looks back half an hour.
- Fast reports. Standard reports that refresh through the day. Useful, but you'd still be looking at a table, not a pulse.
The questions a live view answers are narrow and practical: is anyone here, did that link work, did the traffic from that post show up, is the site still being counted after my change. It doesn't answer "why" or "is this working long term". Those are historical questions.
When real-time analytics is worth having
Real time earns its place when you're acting on the answer within the hour.
| Moment | What to watch live | What you do with it |
|---|---|---|
| Launching a page or product | Visitors in the first minutes, and which page they land on | Fix a broken link or a wrong redirect while people are still arriving |
| Sending a newsletter | The spike in the per-minute chart and its referrer | Confirm tagged links are being counted as email, not "direct" |
| Posting on social or in a community | Where the arrivals come from and which page they open | Reply while the thread is still active |
| Shipping a change | Whether the count carries on as normal afterwards | Spot a tracking tag lost in the deploy, or a drop that follows it |
| Running a sale or a campaign | Orders as they land, and the channel behind them | Push the channel that's paying, today |
| Installing analytics for the first time | Your own test visit appearing | Confirm the tag works before you rely on it |
The last row is the one everyone uses at least once. Open your site in another browser and watch the visit arrive. If it doesn't, check reporting delays, browser exclusions, blockers and the network request before concluding the install failed. The verify guide walks through it.
When daily totals are enough
If you check your numbers once a day or once a week, a live view adds little. Skip it when:
- You're judging what works. One quiet hour says nothing about a page. Look at a week or a month, and compare it with the same period before.
- The site is small. With a few visitors an hour, the live count swings between 0 and 3 and means nothing. Watch for the specific event you care about, such as your own test visit or a post going out.
- You can't act on it. If nothing you'd do changes with the answer, the number is just something to refresh.
Live numbers also move for dull reasons. Your own visits count as visitors unless you exclude them, and tools differ on whether they count bots. A spike in a live view is a prompt to check the source and the page, not proof that something good happened. A live view also shows how many people are on and where they are, not who they are; see what a website owner can see about visitors.
How to read a live view
- People online now. Visitors active in the last minute or so. It's a gauge of the moment, not a daily count, so it's normal for it to bounce around.
- The last half hour, per minute. A row of bars, one for each minute. The right-hand bar is the current minute and is still filling, so ignore its height until the minute is over. Look for a step up that stays (a link took off) or a sharp spike that fades (a post that peaked).
- Where they came from. The referrer, campaign or country. If the sudden jump is all "direct", suspect untagged links, your own clicking or a bot before you celebrate.
- What they're doing. The page they're on and, if you track them, goals and orders. Traffic with no goal can still be a good sign on launch day, but it's worth checking by the end of the week.
One habit saves a lot of false alarms: before you act on a surprise, check that your own browser isn't the cause, and check the time window. A 30-minute view shows nothing about whether the last hour was normal.
What real time looks like in Stickybeak
Real time is what Stickybeak is built around. It's live analytics for every site you own, in early access. Every site sits on one screen, the wall, and each has a card showing who's on now, the last 30 minutes in per-minute bars, the top countries and today's total against the same time yesterday.
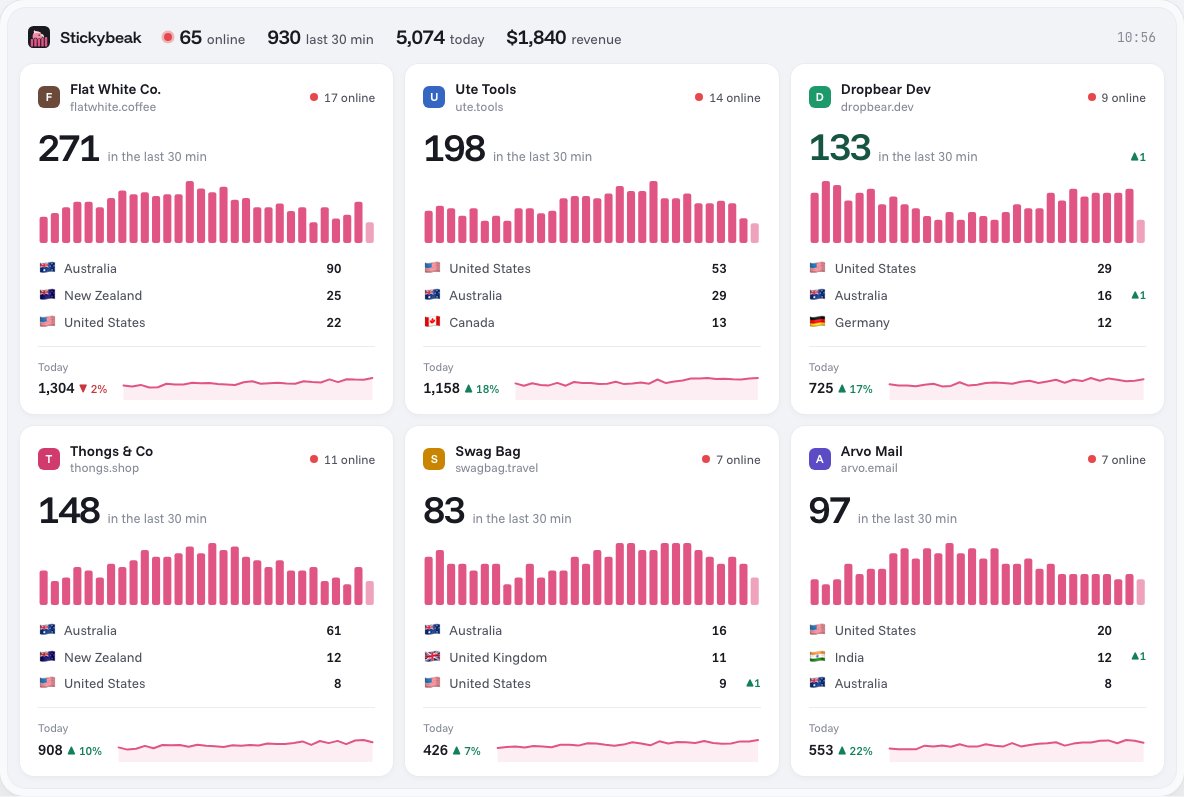
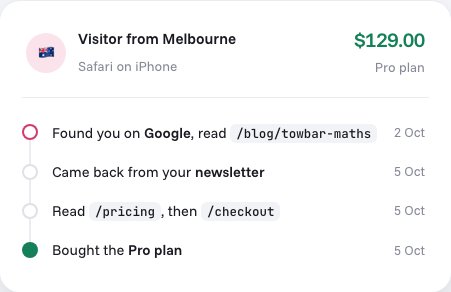
Built for the moments in the table above:
- Sales appear as they land. A note pops up on the wall when an order comes in, and the order keeps its trail: entry page, referrer, every UTM tag and the pages read before buying.
- Press F for a full-screen view that fits every site on one screen. It works on a spare monitor, a TV or a kiosk browser, so a launch or a campaign can run on the wall behind you.
- Click to filter. Click a referrer, page, country or device and the whole page narrows to it, so you can see where a spike came from.
- Notes on charts. Add a note by hand or from a deploy script, so a change in the line has a reason beside it.
- Bots are labelled and kept out of visitor counts, so a crawler doesn't pass as a surge of people.
Setup is one script tag, 4 KB, and the dashboard checks the install for you: it looks for the tag on your homepage and for the first visitor. Any site can use the hosted script, which loads from Stickybeak. Some workspaces can also serve it from their own domain, which needs the domain on Stickybeak's Cloudflare account; the install step shows whether yours can, and if you use it, the check also confirms the script loads from your domain. To keep your own visits out, run localStorage.setItem("stickybeak:ignore", "true") in your browser's console. The quick start walks through the install.
Stickybeak doesn't have a public price yet. If you'd like to try it when there's a spot, leave your email.
If you only use free tools
You can get a basic live view without paying. Google Analytics 4 has the Realtime report described above, which covers the last 30 minutes. It's good for the first-visit check and for watching a newsletter send. Stickybeak's wall puts every site you own on one screen and shows sales as they happen. Use whatever tool you already have for the moments in the table, and only look for something more once you find yourself wanting the answer more than a few times a week. If you're weighing options, the best website analytics tools compares ten with prices, Google Analytics alternatives compares a few more closely, and how to check website traffic covers the basics of reading what you collect. If you look after several sites, tracking many websites at once shows how to set them up and watch them together.
Questions
What is real-time website analytics?
It's analytics that updates as visits arrive, so you can see who is on your site now, where they came from and what they're doing, instead of waiting for a daily report.
How real-time is real time?
It depends on the tool. Some give a live screen that updates within seconds. Others show a short rolling window: Google Analytics 4's Realtime report covers the last 30 minutes. Check how your tool defines it.
Does Google Analytics have real-time data?
Yes. GA4 has a Realtime report that shows activity from the last 30 minutes, including active users in the last 5 and 30 minutes per minute, according to Google's help page for the report.
Do I need real-time analytics?
Only if you act on it within the hour: launching a page, sending a newsletter, shipping a change or running a sale. If you check your numbers daily or weekly, daily totals are enough.
Is real-time data accurate?
It's as accurate as the tool's counting, and no more. Ad blockers can stop a script from loading, and tools differ on whether they count bots. On a small site the live number also swings a lot, so read it as a rough pulse, not an exact count.
How do I check that my tracking is working?
Open your site in a different browser or a private window, then look for that visit in your tool's live view. If it doesn't appear, check for reporting delays, a browser or blocker that excludes the visit, and the tracking request in your browser's network tab before concluding the install failed.