Using the dashboard
Annotations
Analytics annotations pin a short explanation to the moment traffic changed, so chart movements keep their context.
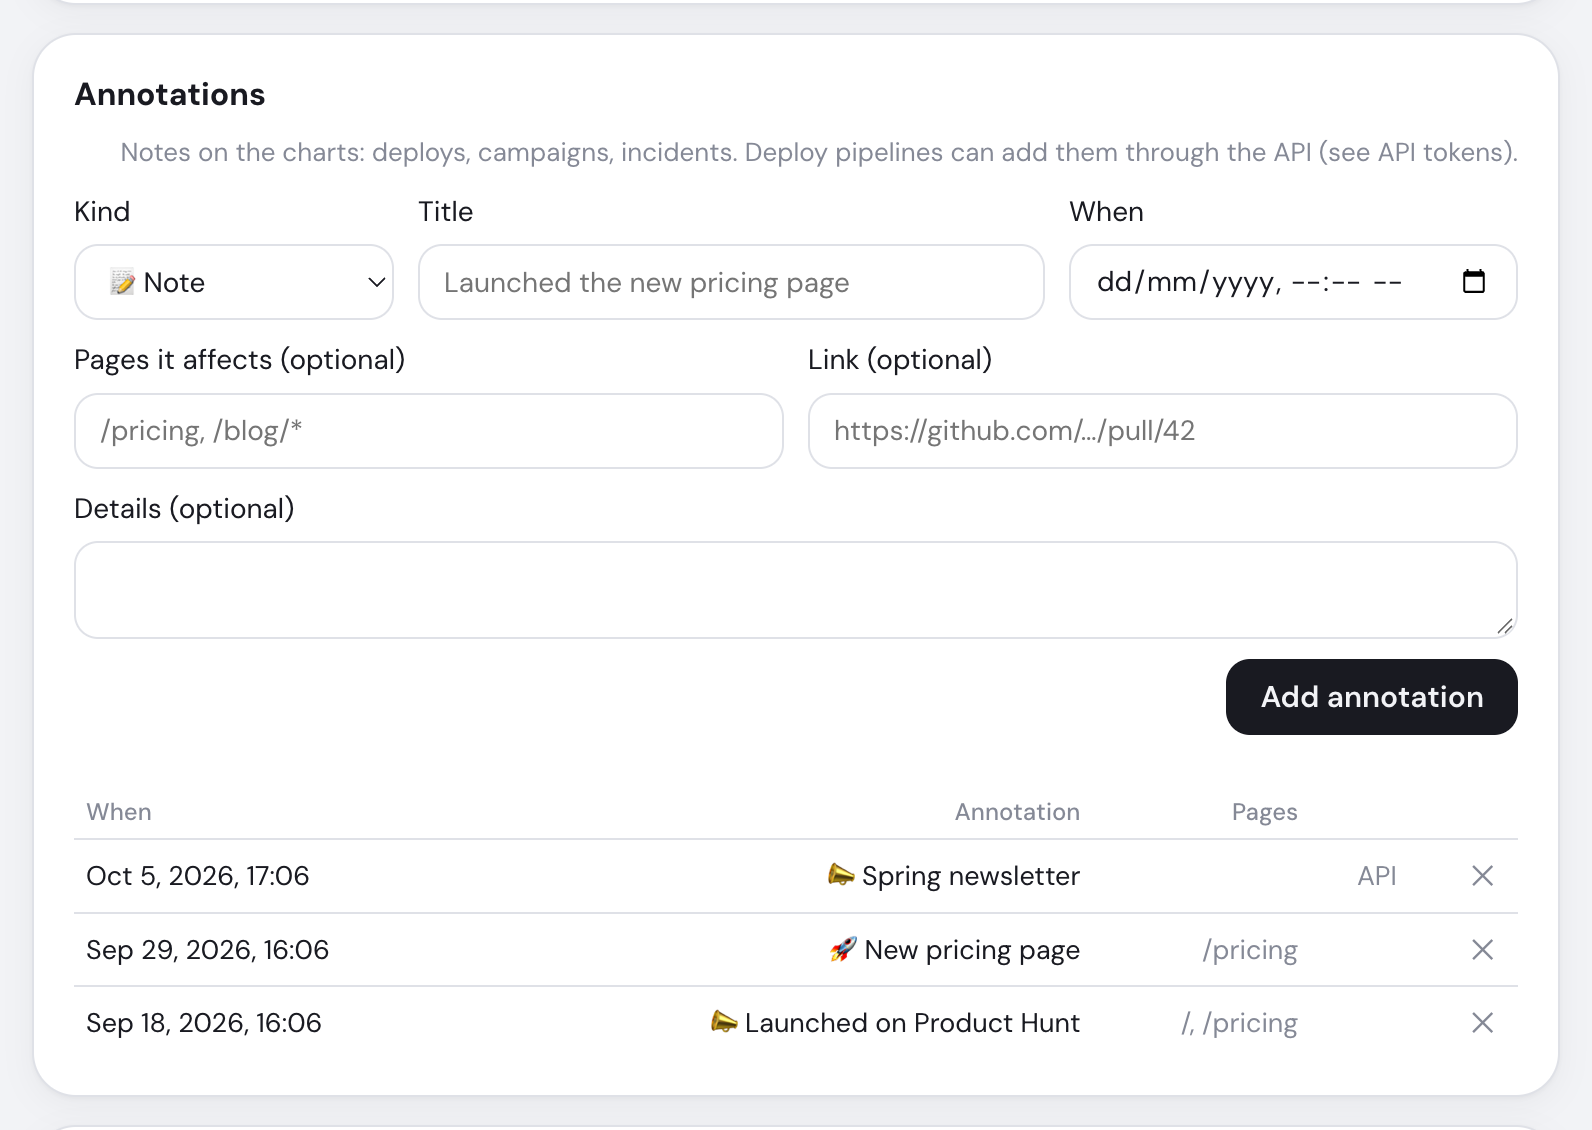
Add one
Open ⚙ Settings → Annotations. Only workspace admins can add or delete them.
| Field | Rule |
|---|---|
| Kind | Note, Deploy, Campaign or Incident |
| Title | Required; up to 200 characters |
| When | Your local time; blank means now |
| Pages | Optional paths such as /pricing, /blog/* |
| Link / Details | Optional URL and up to 5,000 characters |
On the chart
A dashed line and kind icon mark the chart bar. Hover for its title, time, pages, details and link. The latest six appear below the chart. Page filters hide annotations for other paths; annotations without paths always show.
Automate deployment markers
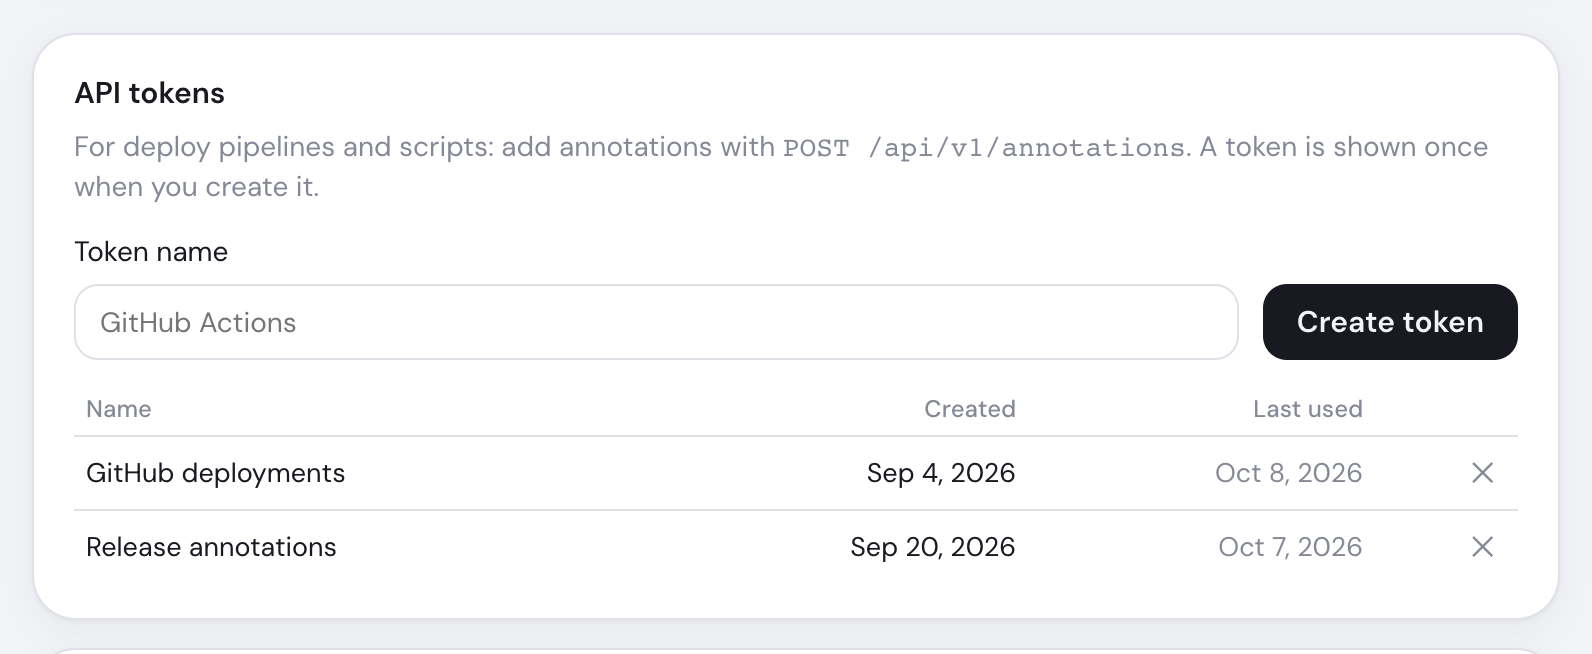
Create a token and call POST /api/v1/annotations. API annotations are labelled API. See the API guide.