Using the dashboard
Funnels and conversion paths
The Conversions panel on a site's page has four views: Goals, Funnels, Paths and In common. Goals counts each goal; the others show how people get to a sale or a goal, and where they drop out.
Goals
Each goal shows the visitors who reached it, the conversion rate and any revenue. Click a goal to see who converted. A goal you add checks the visits Stickybeak already has, so it shows the last 30 days straight away. Setting goals up is covered in Custom goals.
Funnels
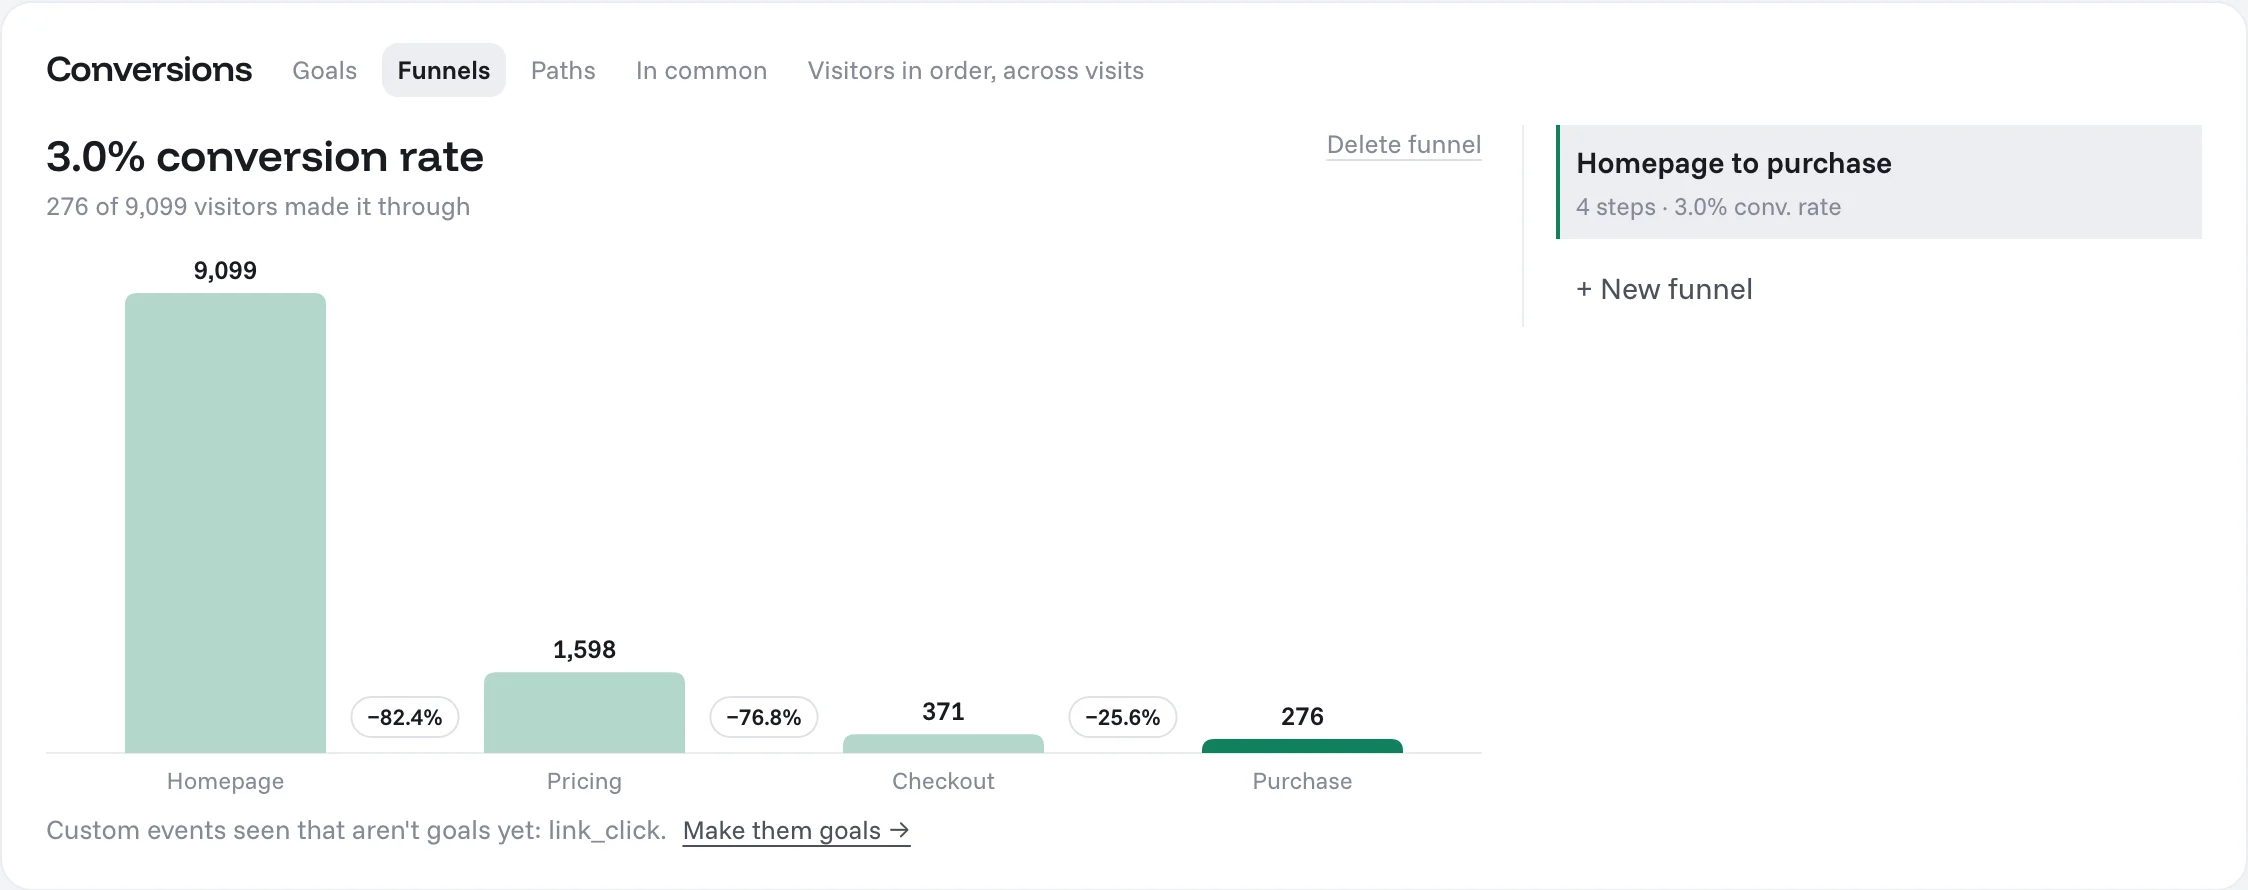
A funnel is a list of steps in order. Each step is a page (like /pricing, or a pattern like /blog/*) or an event (like initiate_checkout or purchase).
Open Funnels and click New funnel
Name it, like "Homepage to purchase".
Add the steps in order
Pick a page or an event for each.
Save
The funnel shows straight away, from the visits already recorded.
Each step shows how many visitors reached it, having done the steps before it in order, and the drop to the next step. The headline is the conversion rate from the first step to the last. Filters on the page apply, so you can compare a funnel for one channel or country with the rest.
Funnels read the raw visits kept for 32 days. For 90 days and longer they use the last 30 days.
Paths
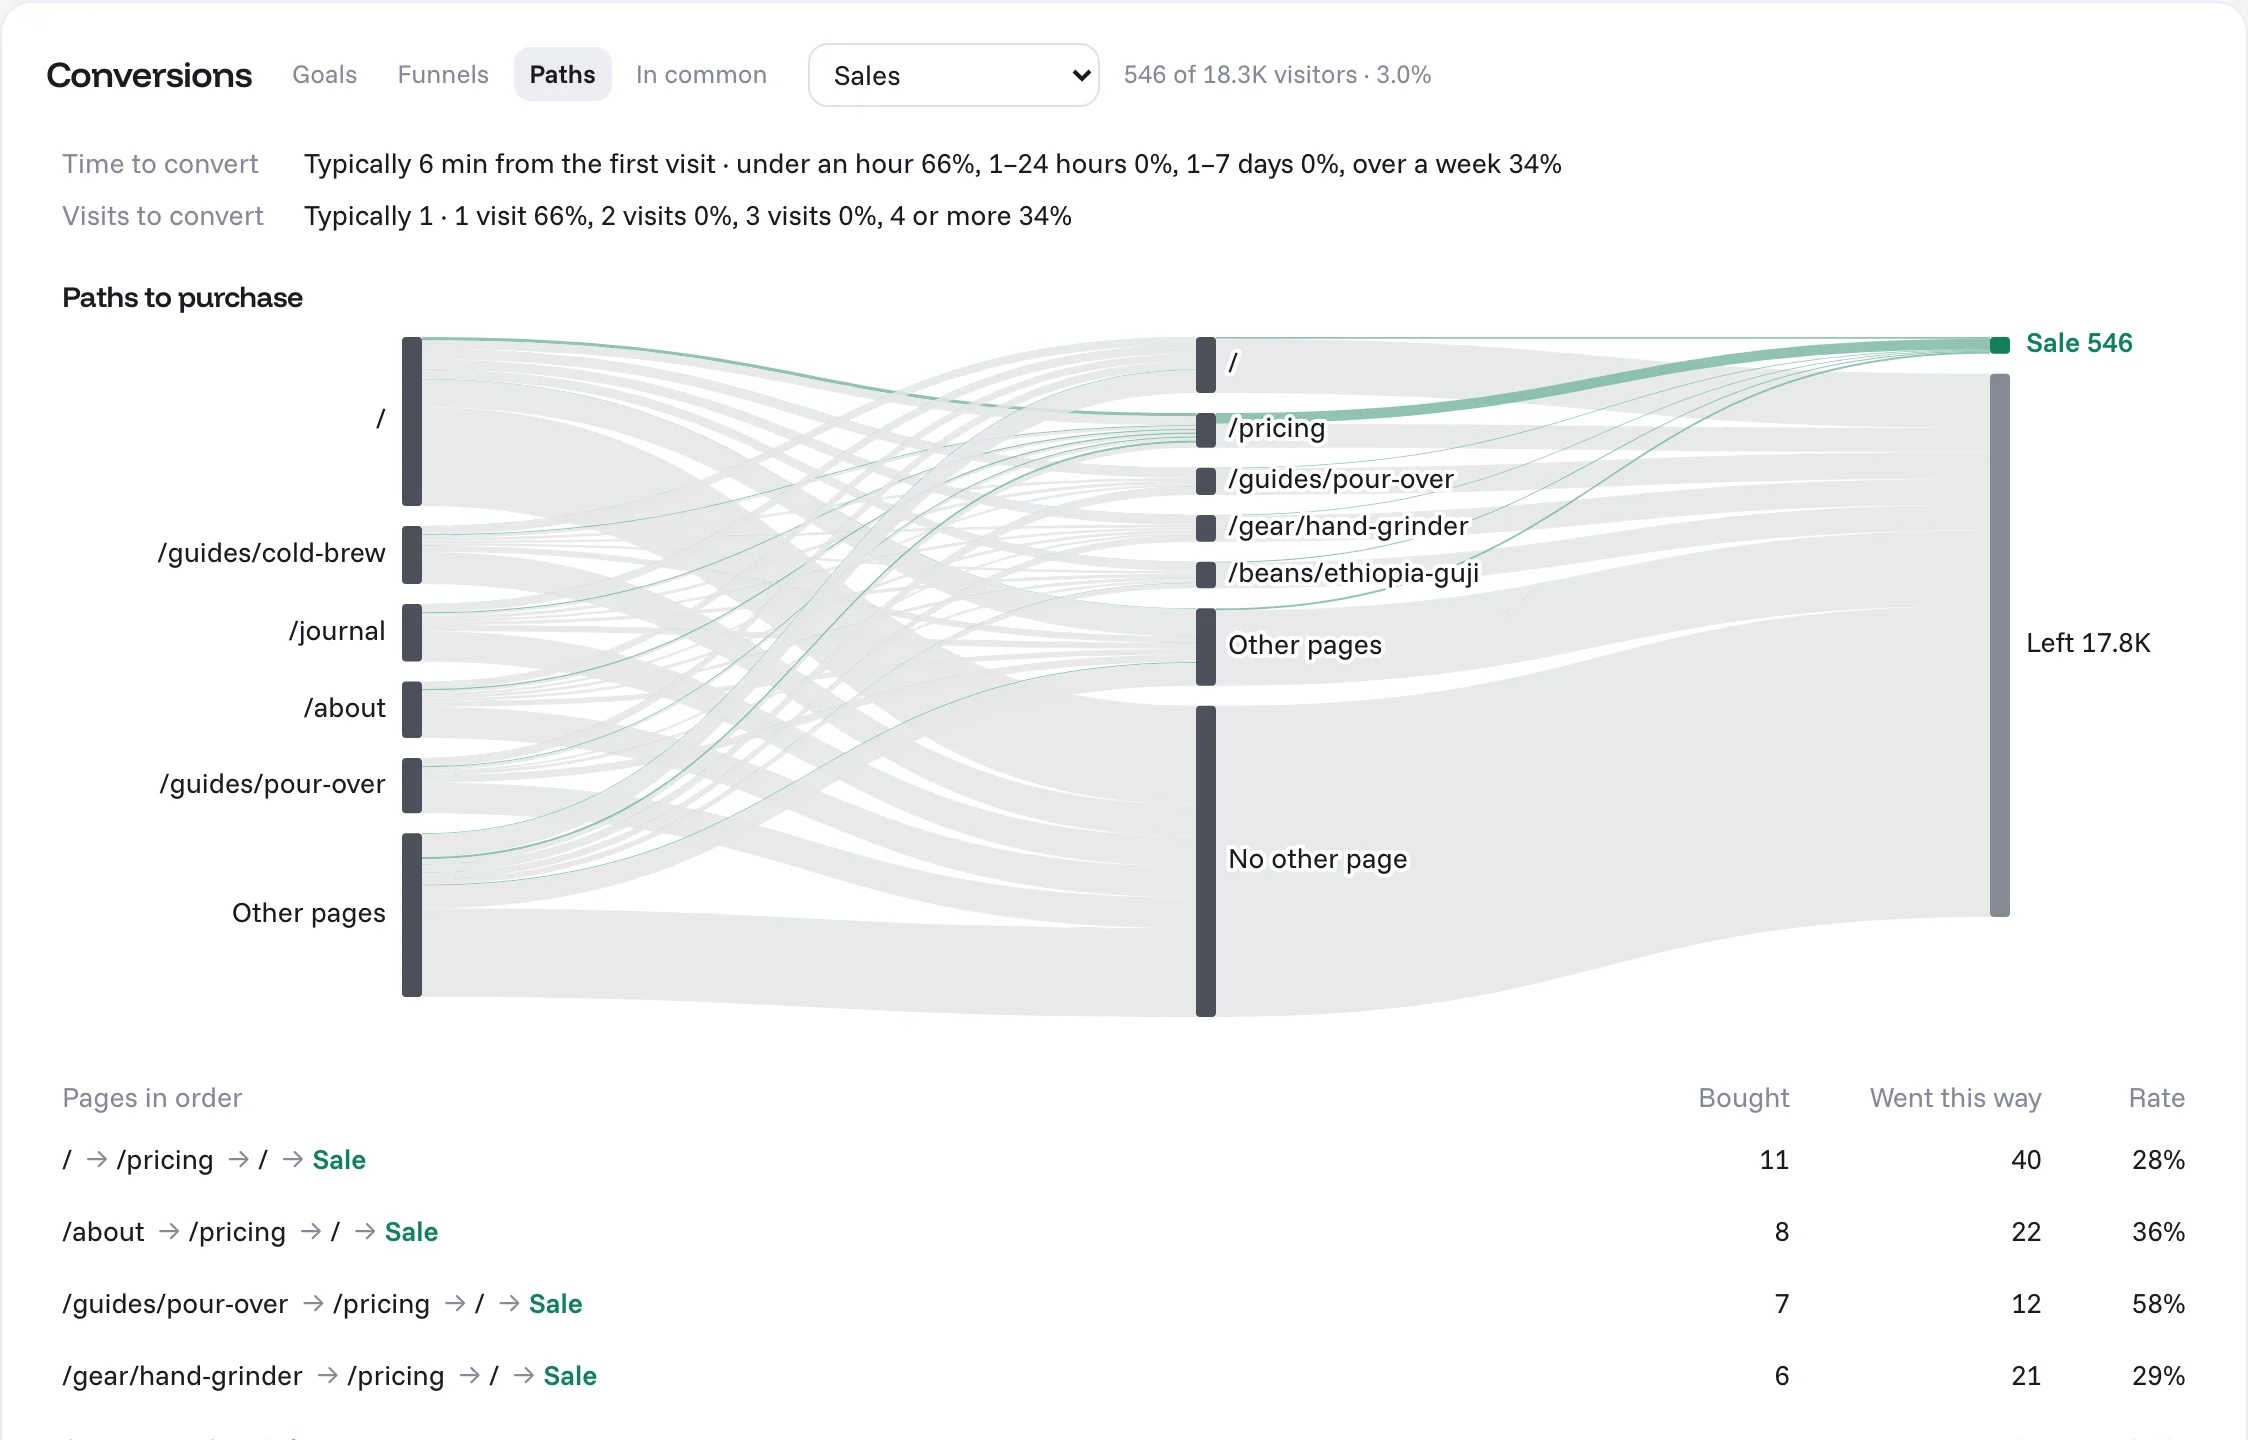
Pick what counts as converting (sales, or any goal) from the menu beside the tabs. Paths then shows:
| Part | What it shows |
|---|---|
| Time to convert | Typically how long from someone's first visit to converting, and how that spreads from under an hour to over a week |
| Visits to convert | Typically how many visits it takes |
| Paths to purchase | A flow from the page people landed on, through the next page, to converting or leaving |
| Pages in order | The most common routes up to the moment people converted, with how many went that way, how many converted and the rate |
With the cookieless script, visits can't be joined across days, so time and visits to convert only count the same day.
In common
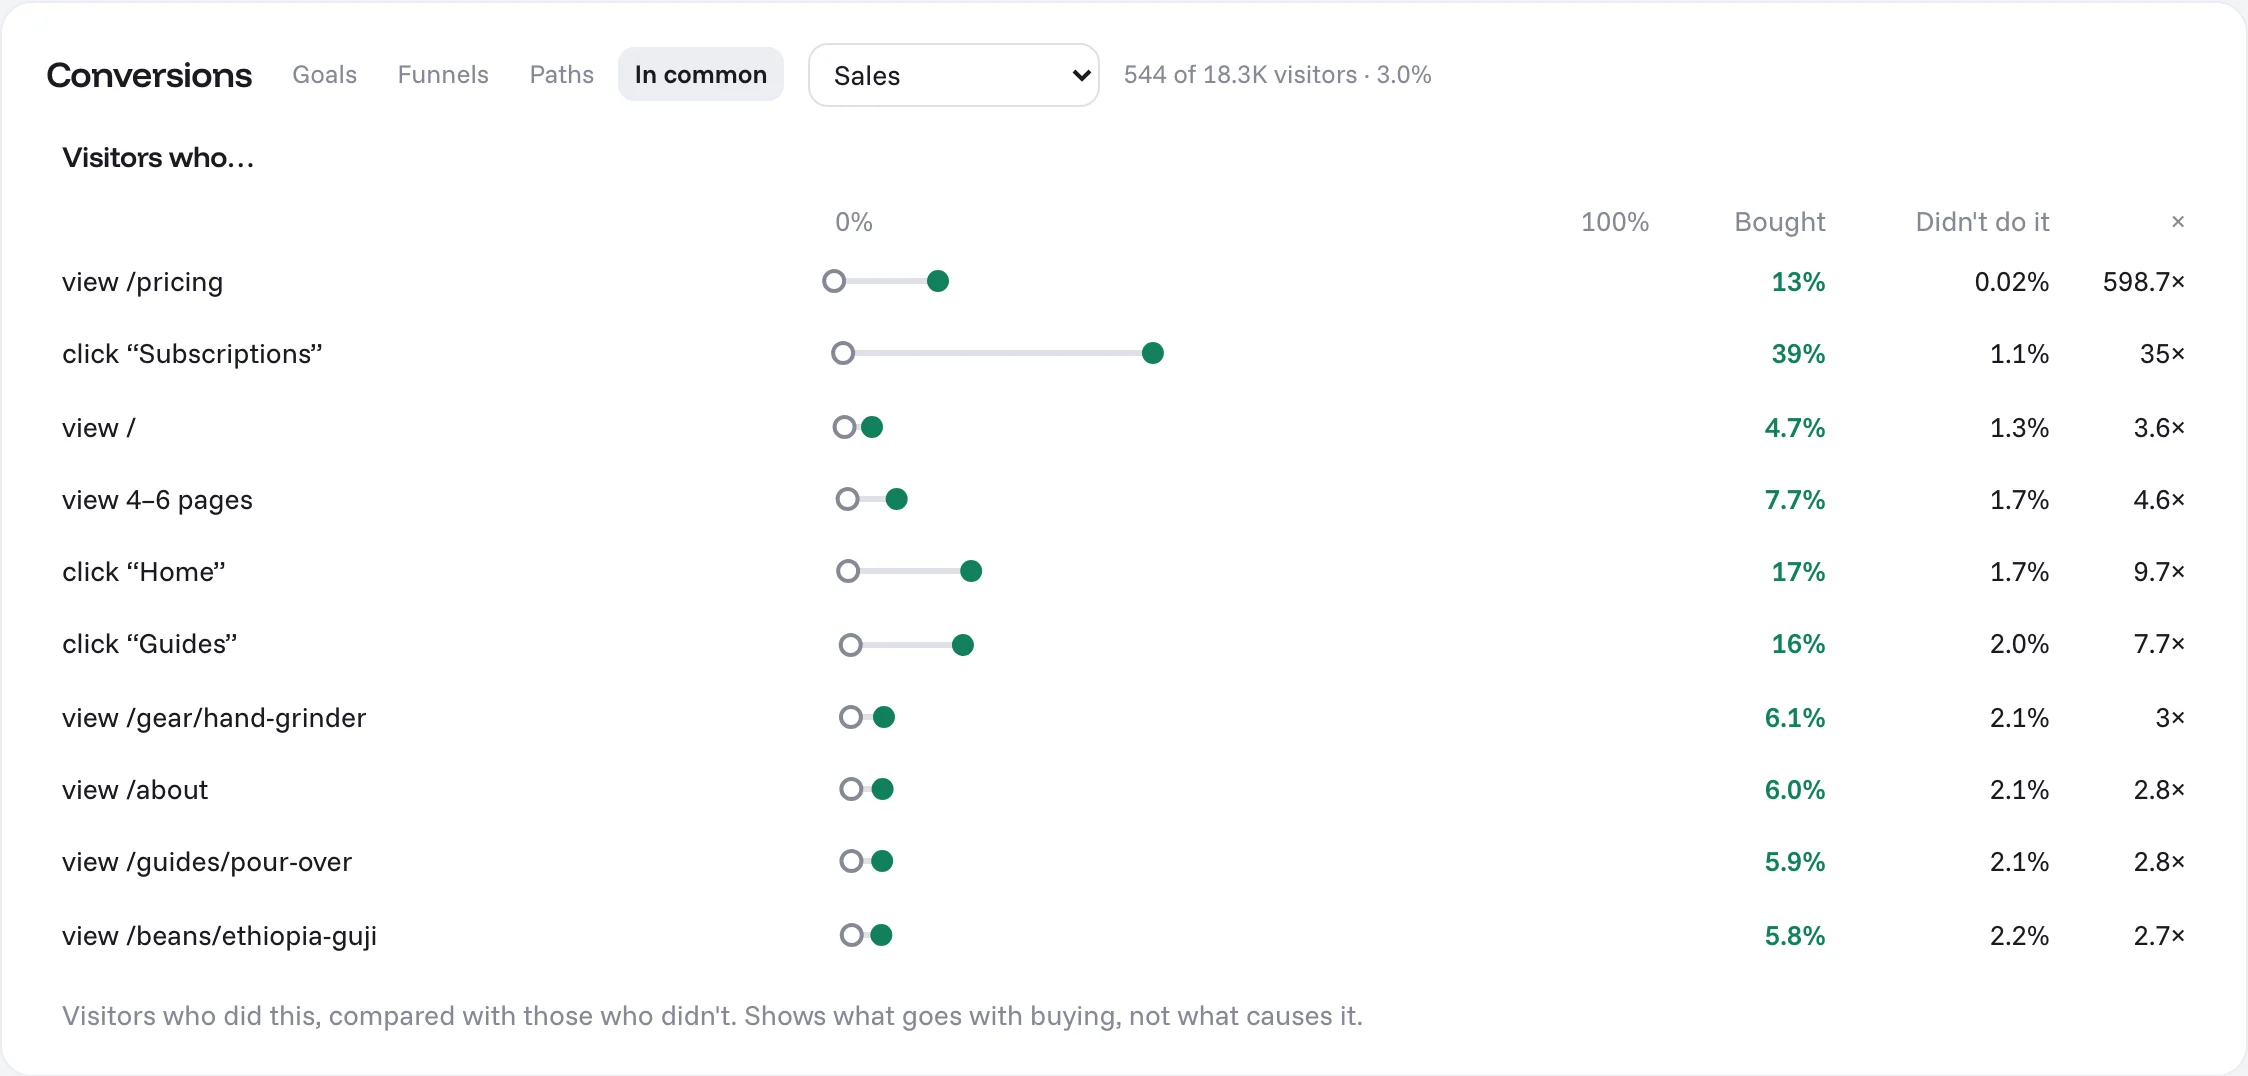
In common compares visitors who did something (viewed a page, clicked a link, read a number of pages) with visitors who didn't, and shows the conversion rate for each and how many times higher it is.
It shows what goes with converting, not what causes it. Someone who views the pricing page is more likely to buy partly because they were already thinking about buying. Use it to find pages and links worth testing, then check with a change and an annotation.
In the API
GET /sites/:id/funnels and GET /sites/:id/paths return the same data. See API.